This article serves as a quick introduction to ServiceTick and lets you know how to carry out common tasks.
Logging In
To log into the ServiceTick console, copy the following URL into your web browser, or click here:
https://console.servicetick.com/VOC/Auth/Login
Once on the Login page, simply enter your email address + password and click the ![]() button.
button.
If your login details match our records, you will be logged in and greeted with your Dashboard.
If there was a problem with your details, the system will tell you and ask you to try again.
If you have forgotten your password, you can click the ![]() link, that can be found next to the 'Log in' button. This will ask you to enter your email address and the system will send you an email which you can use to reset your password.
link, that can be found next to the 'Log in' button. This will ask you to enter your email address and the system will send you an email which you can use to reset your password.
If you are logging in for the first time, we recommend that you start by changing your password. This can be done by visiting the 'My Account'. Click here to find out more.
Viewing Scores and KPIs
Your Dashboard is the first screen that you see after logging in. It provides an overview of your survey responses and the key metrics for your organisation. If you would like to learn more about how to use the Dashboard, click here.
Your Dashboard is made up of widgets, which are highly configurable and allow your data to be presented in a number of different formats. Your widgets are set up for you by ServiceTick when you first join us. To find out more about each of the widgets we offer, click here.
Viewing Responses
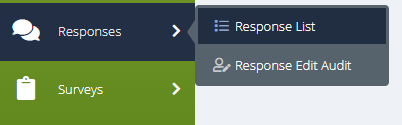
To start viewing survey responses, click/hover on the 'Responses' option in the console side-menu, and choose 'Response List' from the options that appear.
This page shows you the individual survey responses that your customers have given to your surveys. To find out more about how to use this page, click here.
You can then use this page to view individual survey responses and dive deeper into the detail. Click here to find out more.
Filtering Data
Whilst on any page within the ServiceTick console, you can filter the data you are viewing via the ![]() button, found towards the top right of the page.
button, found towards the top right of the page.
To find out more about filtering options available to you, click here.
Changing Date Ranges
Whilst on any page within the ServiceTick console, you can change the date range of data that you are currently viewing by using the ![]() button, found towards the top right of the page.
button, found towards the top right of the page.
The button will display the current date range that is applied.
To see a more detailed run-through of how to apply different date ranges, click here.
Exporting Data (Saving as CSV/Excel File)
Widget and Page Exports
WidYou can export the data from many widgets and console pages by clicking the ![]() button and then choosing 'Export'. If available, the button will be in the top right corner of the widget or page.
button and then choosing 'Export'. If available, the button will be in the top right corner of the widget or page.
Doing so will download the appropriate data in .csv to your local computer.
Response Exports
You can also conduct survey response exports - this can be done by choosing 'Responses' in the console side menu, and then 'Response List' from the options that appear:
Once on the Response List, choose 'Exports' from the tabs at the top of the page.
For a detailed run-through of how to use this page, click here.
If you would like to view all of the response exports you have previously run, they can be found on the 'My Exports' page. Click here to find out more.
Accessing Advanced Reporting (Insights)
If your account has the appropriate permissions, you may see 'Surveys', 'KPI' and 'Alerts' options in your console side-menu. These options each contain various Insights pages which can be used to analyse your data in more detail.
Click on the links above if you would like to read about these sections in more detail.
Ready to put this into practice?
![]()
Comments
0 comments
Please sign in to leave a comment.