What is the KPI Trend By Theme report?
This report allows you to analyse KPI performance for your verbatim themes and topics over time, for your currently selected date range and taking into account any filters you have applied.
How do I access this report?
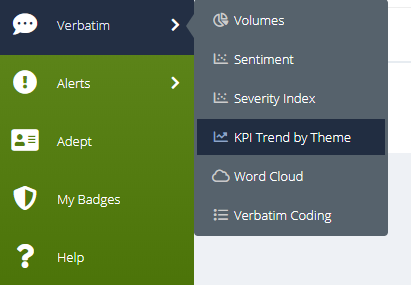
This screen can be reached by hovering on ‘Verbatim’ in the side menu, and choosing 'KPI Trend By Theme' from the options that appear:
What information does this report give me?
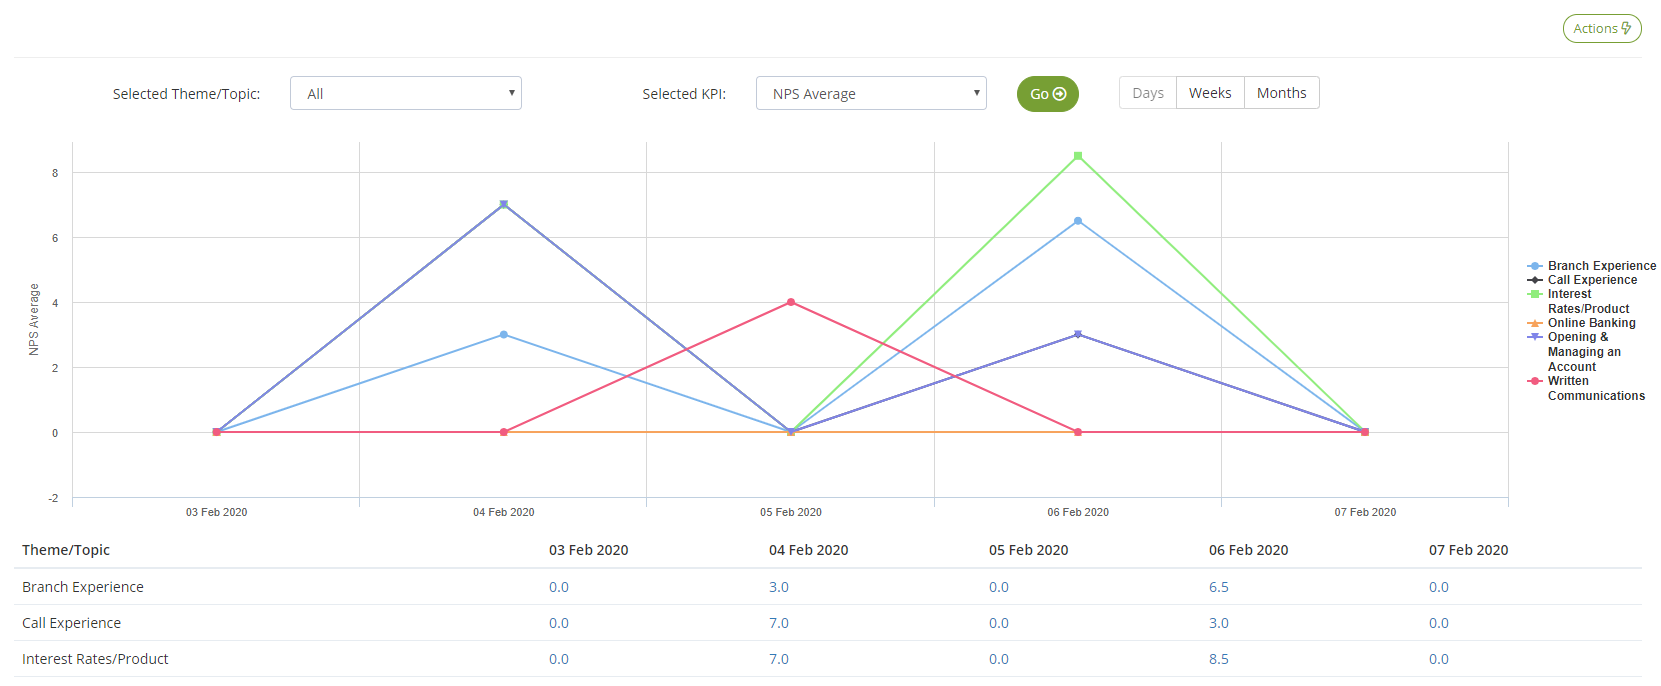
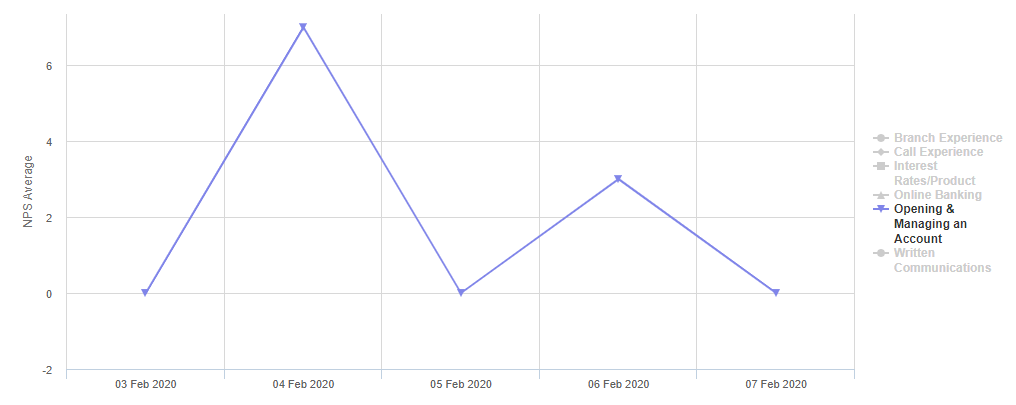
This screen contains a trend chart that shows your KPI performance for each of your verbatim themes and topics:
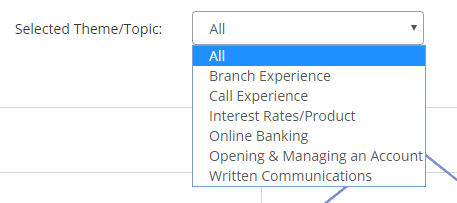
You can select which verbatim theme or topic to use in driving the chart via the 'Selected Theme/Topic' dropdown above the chart:
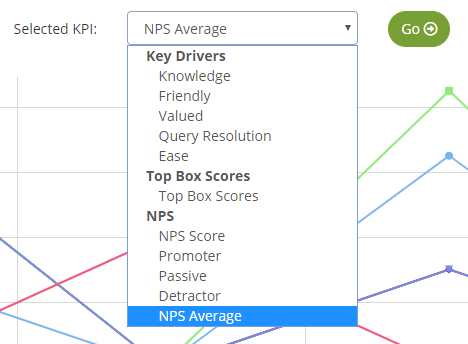
And the KPI you would like to use via the 'Selected KPI' dropdown:
Once you have made your selections, click the ![]() button to update the chart.
button to update the chart.
You can also change the time intervals used for the chart via the Days/Weeks/Months buttons at the top right of the chart:
![]()
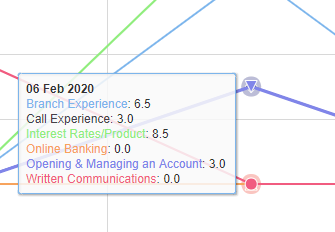
Hovering on a data point shows you a detailed score breakdown for all data points at that time interval:
And you can customise which verbatim themes or topics are shown on the graph by clicking the corresponding values in the chart legend. Clicking them once hides them from the chart, and clicking them again adds them back in:
Below the chart is a data table that summarises all the data currently being used to drive the chart:
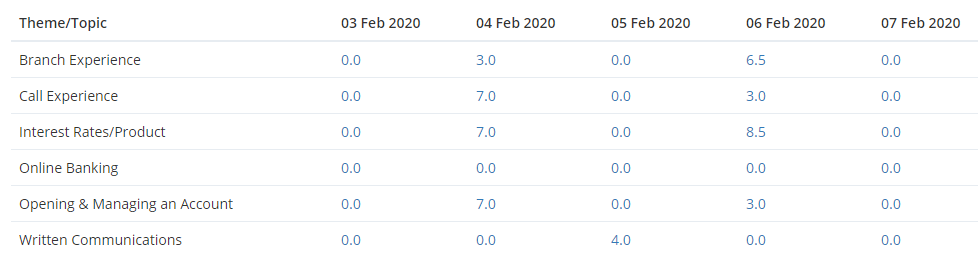
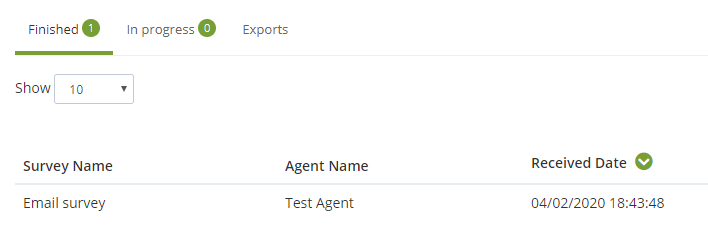
Each value in the data table has clickthrough capability, which means clicking on a number will open a filtered view of the associated survey responses in a new window, allowing you to quickly target ones of interest:
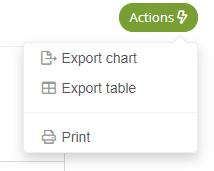
If you would like to export the trend chart, data table or print the page, this can be achieved via the 'Actions' button at the top right of the page:
Ready to put this into practice?
![]()
Comments
0 comments
Please sign in to leave a comment.