What is the Verbatim Sentiment report?
This report shows your sentiment score over time as well as the distribution of sentiment for each of your verbatim themes and topics.
How do I access this report?
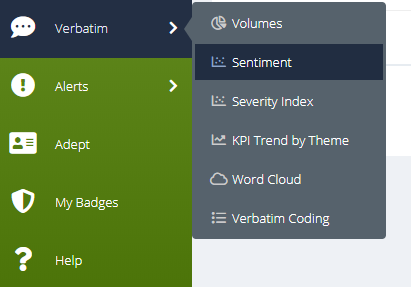
This screen can be reached by hovering on ‘Verbatim’ in the side menu, and choosing 'Sentiment' from the options that appear:
What information does this report give me?
At the top of the report, you will see a sentiment summary for your current date range and taking into account any filters you have applied.

This summary shows you:
- Your average sentiment score (on a scale between -1 and 1)
- The percentage and count of verbatims that had a positive sentiment
- The percentage and count that had a neutral sentiment
- The percentage and count that had a negative sentiment
Below this summary, you will see a trend chart illustrating your sentiment score over time (for your current date range):

And below the chart, a data table that summarises the same data.
The intervals used for the trend chart can either be days, weeks or months, and these can be selected using the button above the chart:
![]()
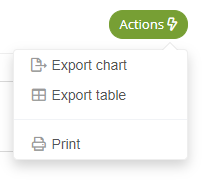
If you would like to export the chart, the data table or print them, this can be achieved via the 'Actions' button, found to the top right of the chart:

The next section contains stacked bars which, by default, shows you the breakdown of sentiment for each of your themes:
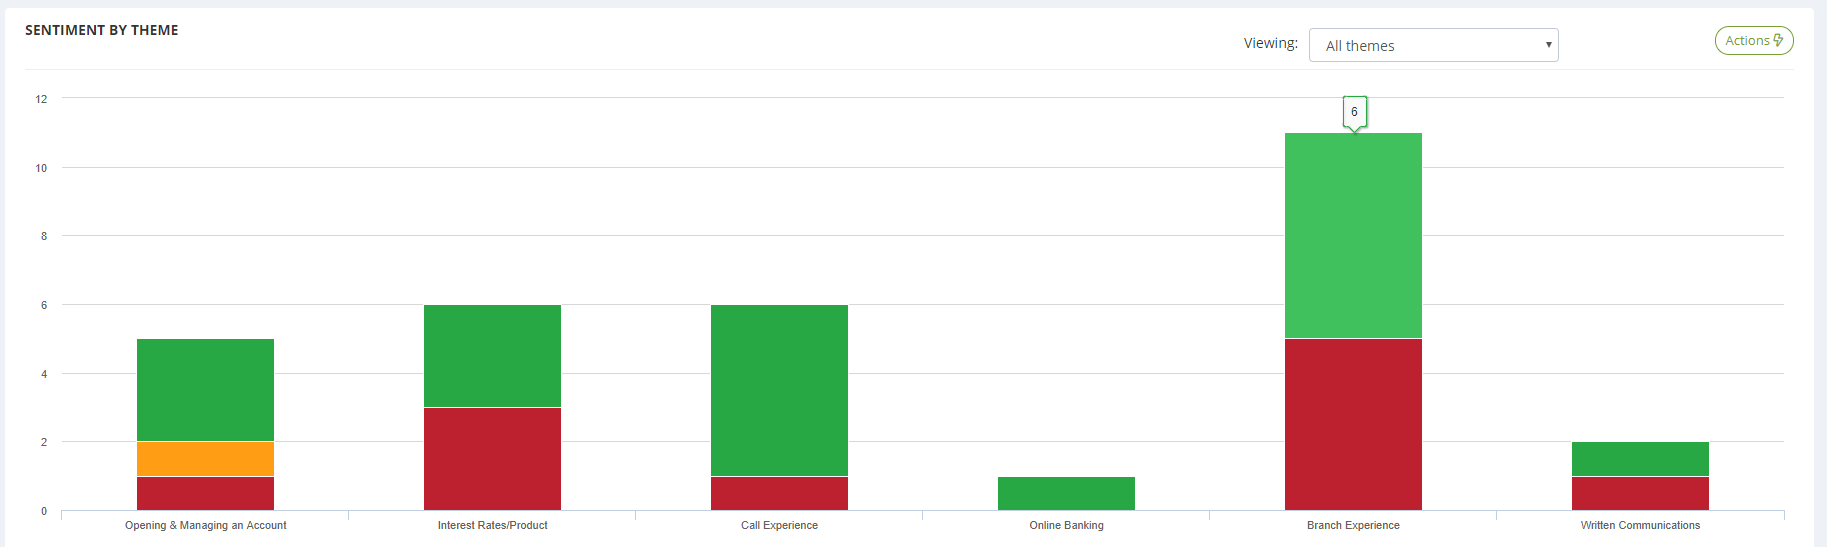
The red sections denote negative sentiment, amber is neutral and green is positive.
You can hover on a bar segment to see the number of verbatims that had this theme and sentiment.
If you would like to view a more detailed sentiment breakdown for a certain theme, you can select it in the 'Viewing' dropdown menu to the top right of the chart.
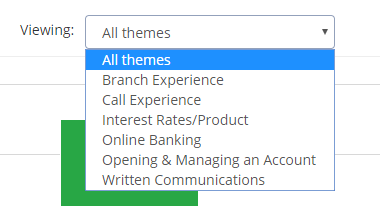
Doing so will reload the chart to show you the sentiment distribution for each topic within the selected theme.
Below the stacked bar chart is a data table that summarises the same data:
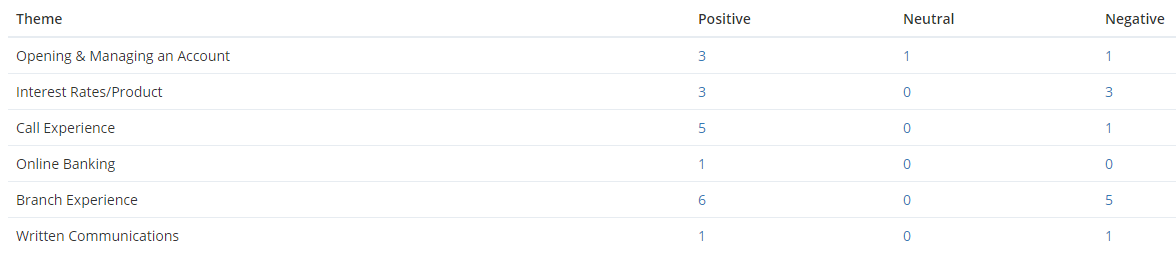
Each number within the data table is clickable, and clicking one will load a filtered view of the Response List, to show you those responses that contained the verbatims with the given theme/topic and sentiment:
If you would like to export the stacked bar chart, data table or print them, this can again be done via the 'Actions' button to the top right of the chart:
Ready to put this into practice?
![]()
Comments
0 comments
Please sign in to leave a comment.